When a Linux server starts to misbehave, top and its siblings, htop and btop, are the first tools I turn to for troubleshooting. If you spend enough time in Linux, like I have, you eventually use all three.
They all answer the same basic question: what is this system doing right now? But, I have found each one to have its own uniqueness, depending on the situation.
top
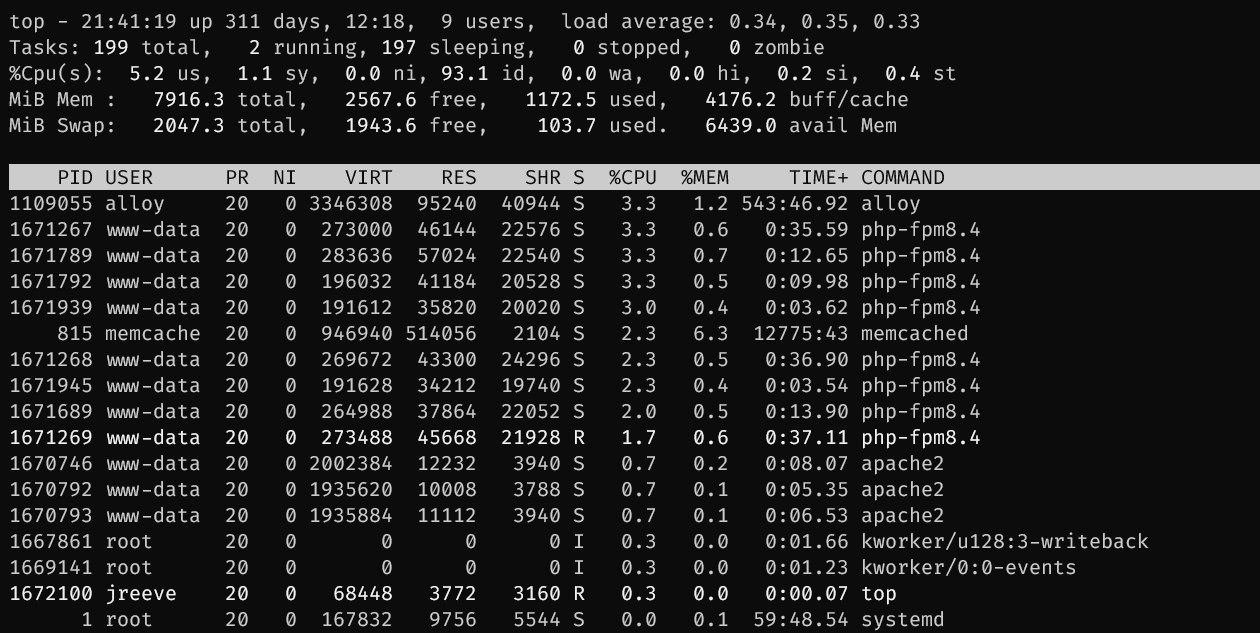
top is installed by default on every Linux distribution. It’s not pretty, but it’s dependable because it’s always there. The best monitoring tool in the world is not helpful if you cannot count on it being present when things are already going pear-shaped.
I specifically reach for top when troubleshooting high swap usage. top lets me add the swap column and sort by it. That is a very practical use case, and one that keeps top relevant even when more polished tools are available.
The downside is usability. top feels like a program from a bygone era. Sorting by CPU or memory requires keyboard commands. The interface is monochrome and dense. It is functional, not friendly.
That said, it is still worth knowing well. When I am dropped into an unfamiliar Linux environment and need answers immediately, top is often the first thing I run.
htop
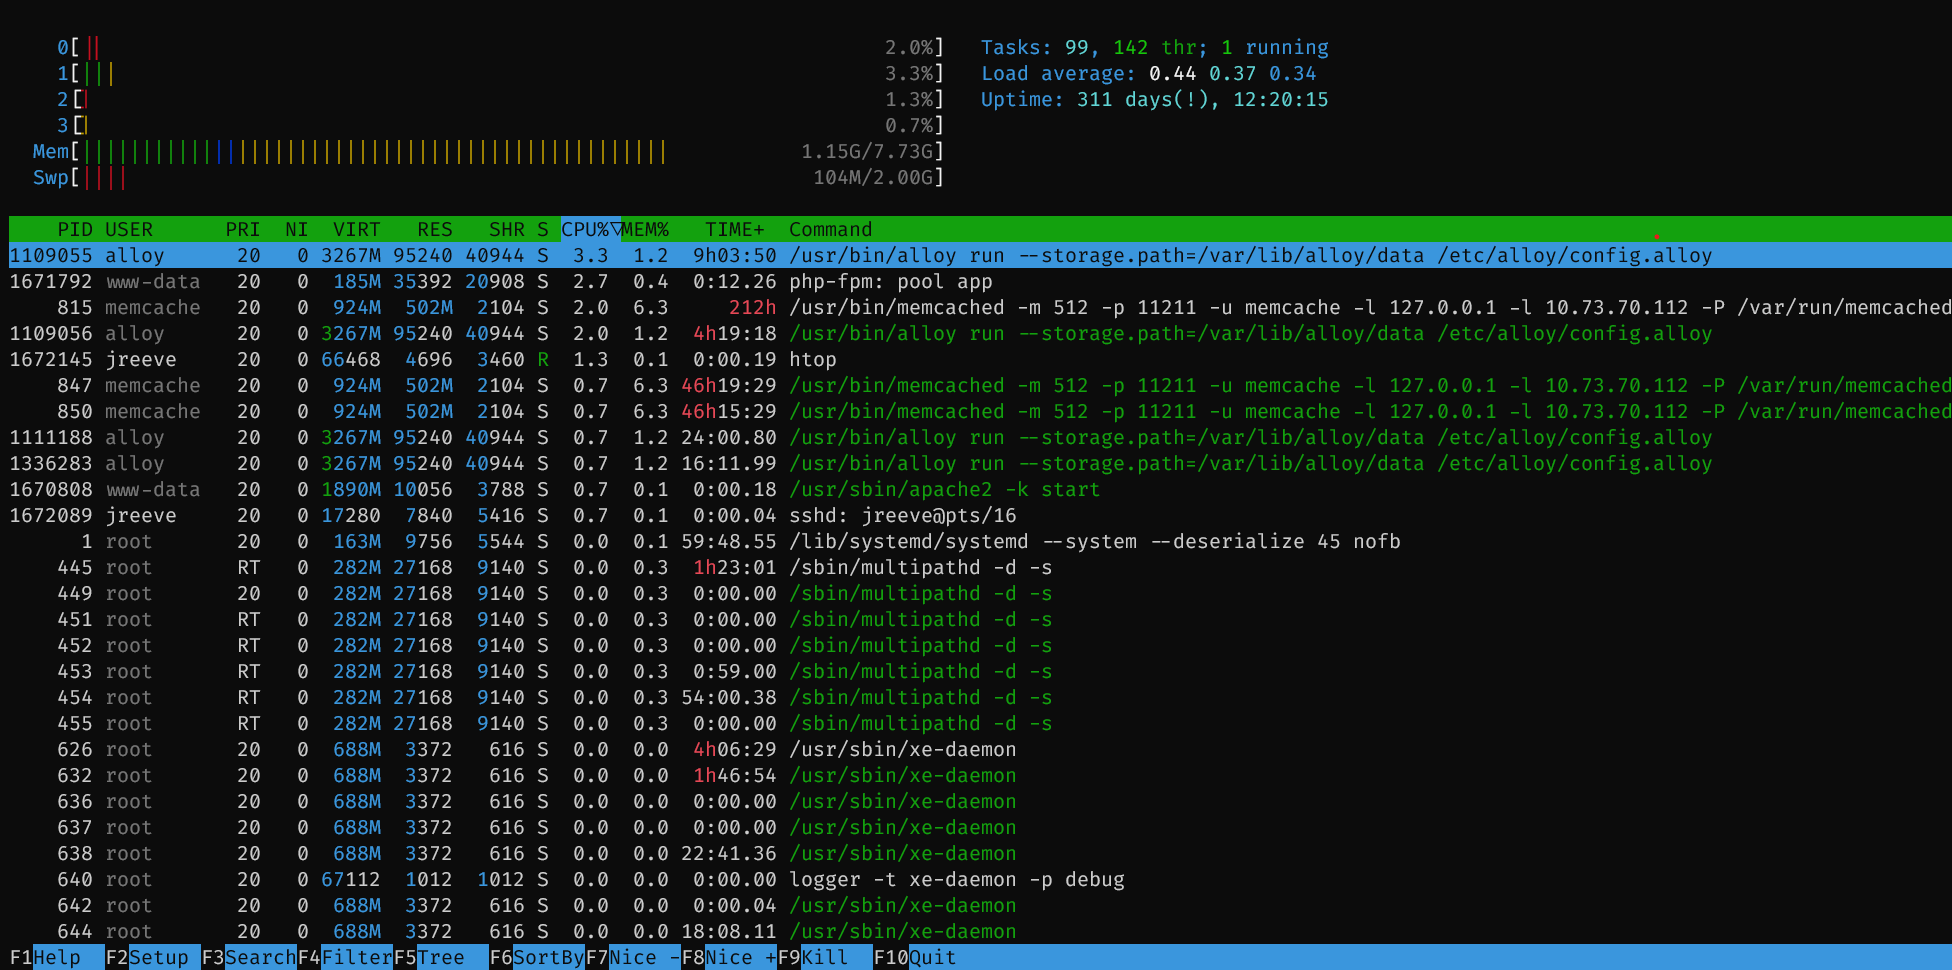
htop is the practical upgrade.
It keeps the same core purpose as top, but presents the information in a colorful and visual manner that is much easier to parse quickly. CPU and memory bars are more readable. Scrolling through processes is easier. Killing a process or changing its priority takes less effort. You spend less time remembering commands and more time looking at the actual problem.
This is one of the first tools I install on servers I administer. It strikes the best balance between simplicity and usability.
When I want a quick visual of CPU usage, memory usage, and overall load, htop is usually where I start. I will often sort by CPU% or MEM% to see which processes are consuming more than they should. For that kind of day-to-day troubleshooting, htop is more intuitive than top because the information is easier to absorb immediately.
Its main drawback is that it is not guaranteed to exist. On many servers you have to install it yourself:
sudo apt install htop
It also uses a little more overhead than top, though in practice that difference is usually negligible on any modern system.
btop
btop is the modern, better designed alternative. For newer Linux users, btop is often the most approachable of the three.
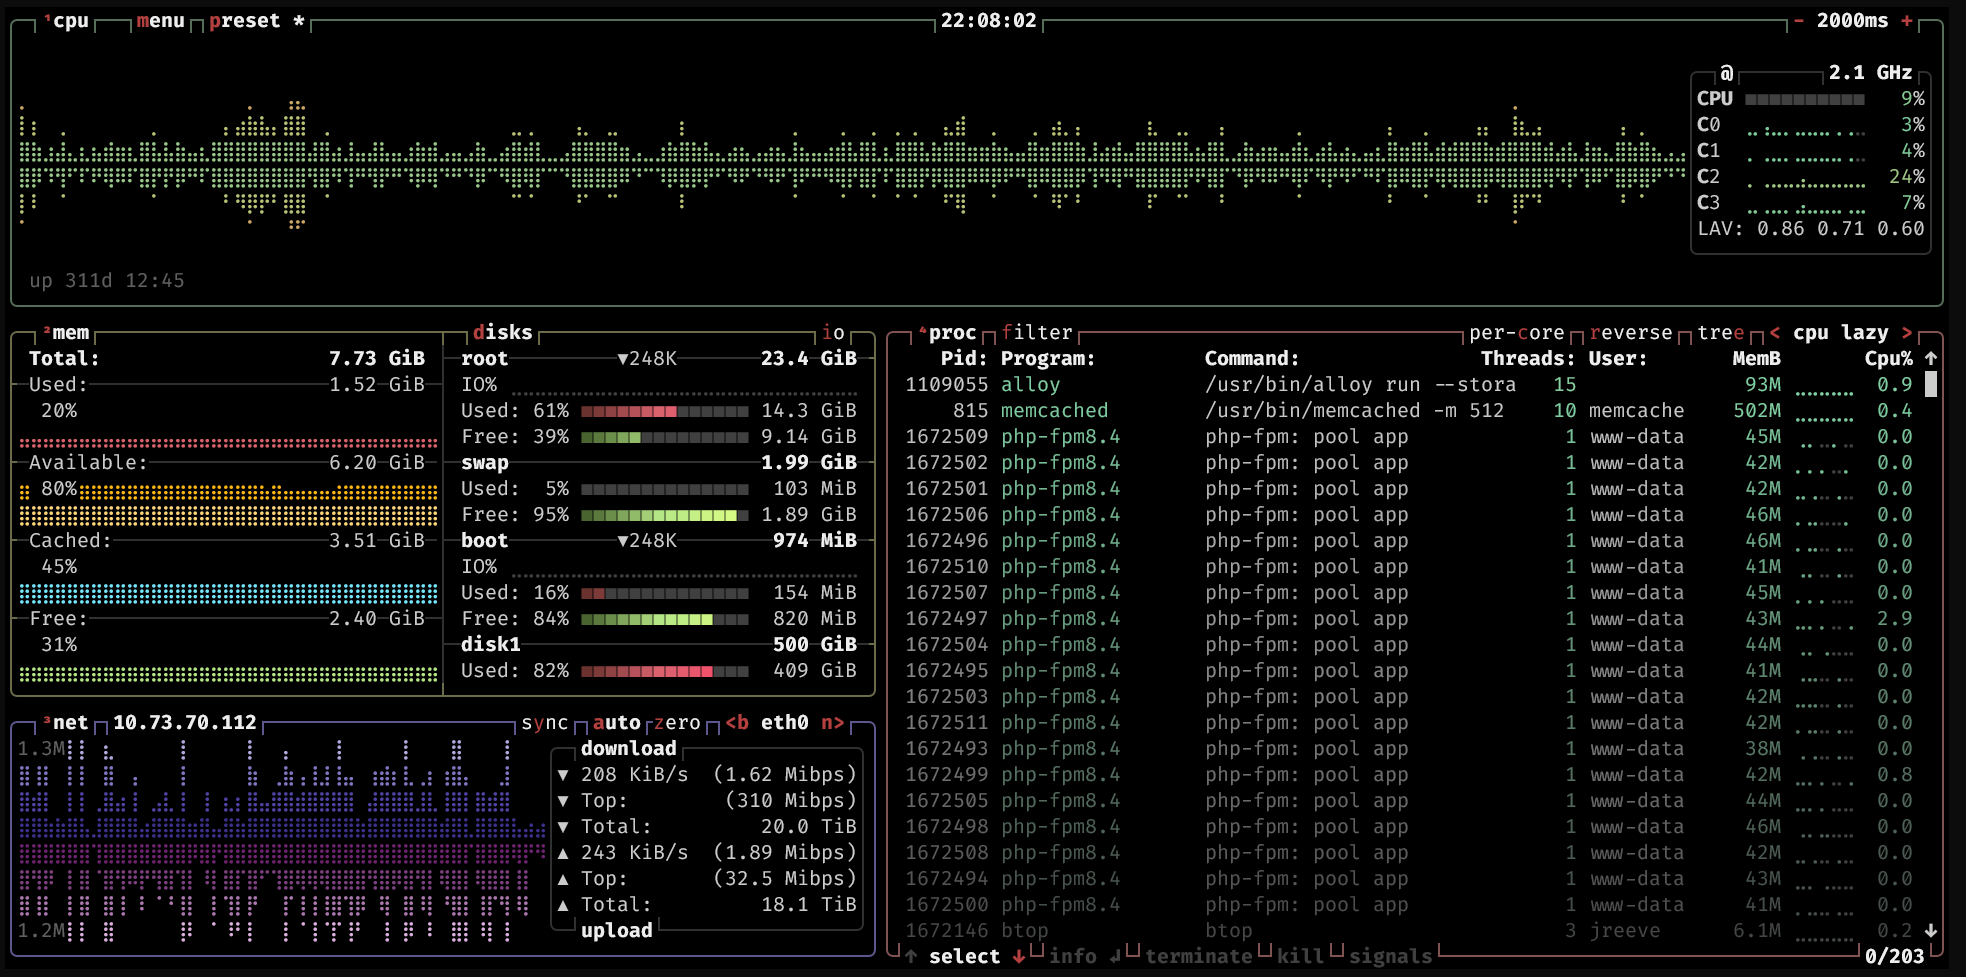
If top is utilitarian and htop is practical, btop is comprehensive. It gives you CPU, memory, disks, network activity, and process information in a single dashboard that is easy to read at a glance. The graphs are useful. The layout is clean. It feels like it was designed by someone who understands the limitations of the terminal well enough to push its boundaries.
One feature that makes btop especially useful is its tree view. When I need to see how many children a process has spawned, btop makes that obvious very quickly. It also does a better job of showing how much memory each of those children is using, which is exactly the kind of detail that matters when one parent process quietly fans out into a much larger resource problem.
It is also my go-to when I need to analyze network activity on the private and public network interfaces. btop quickly shows me if the network is maxed out and becoming the bottleneck.
Like htop, it usually needs to be installed first:
sudo apt install btop
It is a little heavier than htop, but still not heavy in any meaningful sense on normal hardware.
Quick comparison
| Feature | top | htop | btop |
|---|---|---|---|
| Availability | Pre-installed | Installed separately | Installed separately |
| Interface | Plain text | Interactive and easier to read | Polished and visual |
| Navigation | Keyboard commands | Keyboard plus limited mouse support | Keyboard and mouse friendly |
| Best at | Troubleshooting swap | CPU and memory triage | Tree view, network view, and broad system overview |
| Resource usage | Very low | Low | Low to moderate |
Which one should you use?
Use top when you are on a minimal or production system and need something that is guaranteed to be there, especially if you are chasing down swap usage.
Use htop when you want the best all-around process viewer and a fast visual read on CPU, memory, and load.
Use btop when you want a more complete dashboard, especially if you need to identify network problems or inspect process trees and see how resource usage rolls up across child processes.
If I could only keep one installed on a Linux machine, I would probably choose htop. It is the best middle ground.